
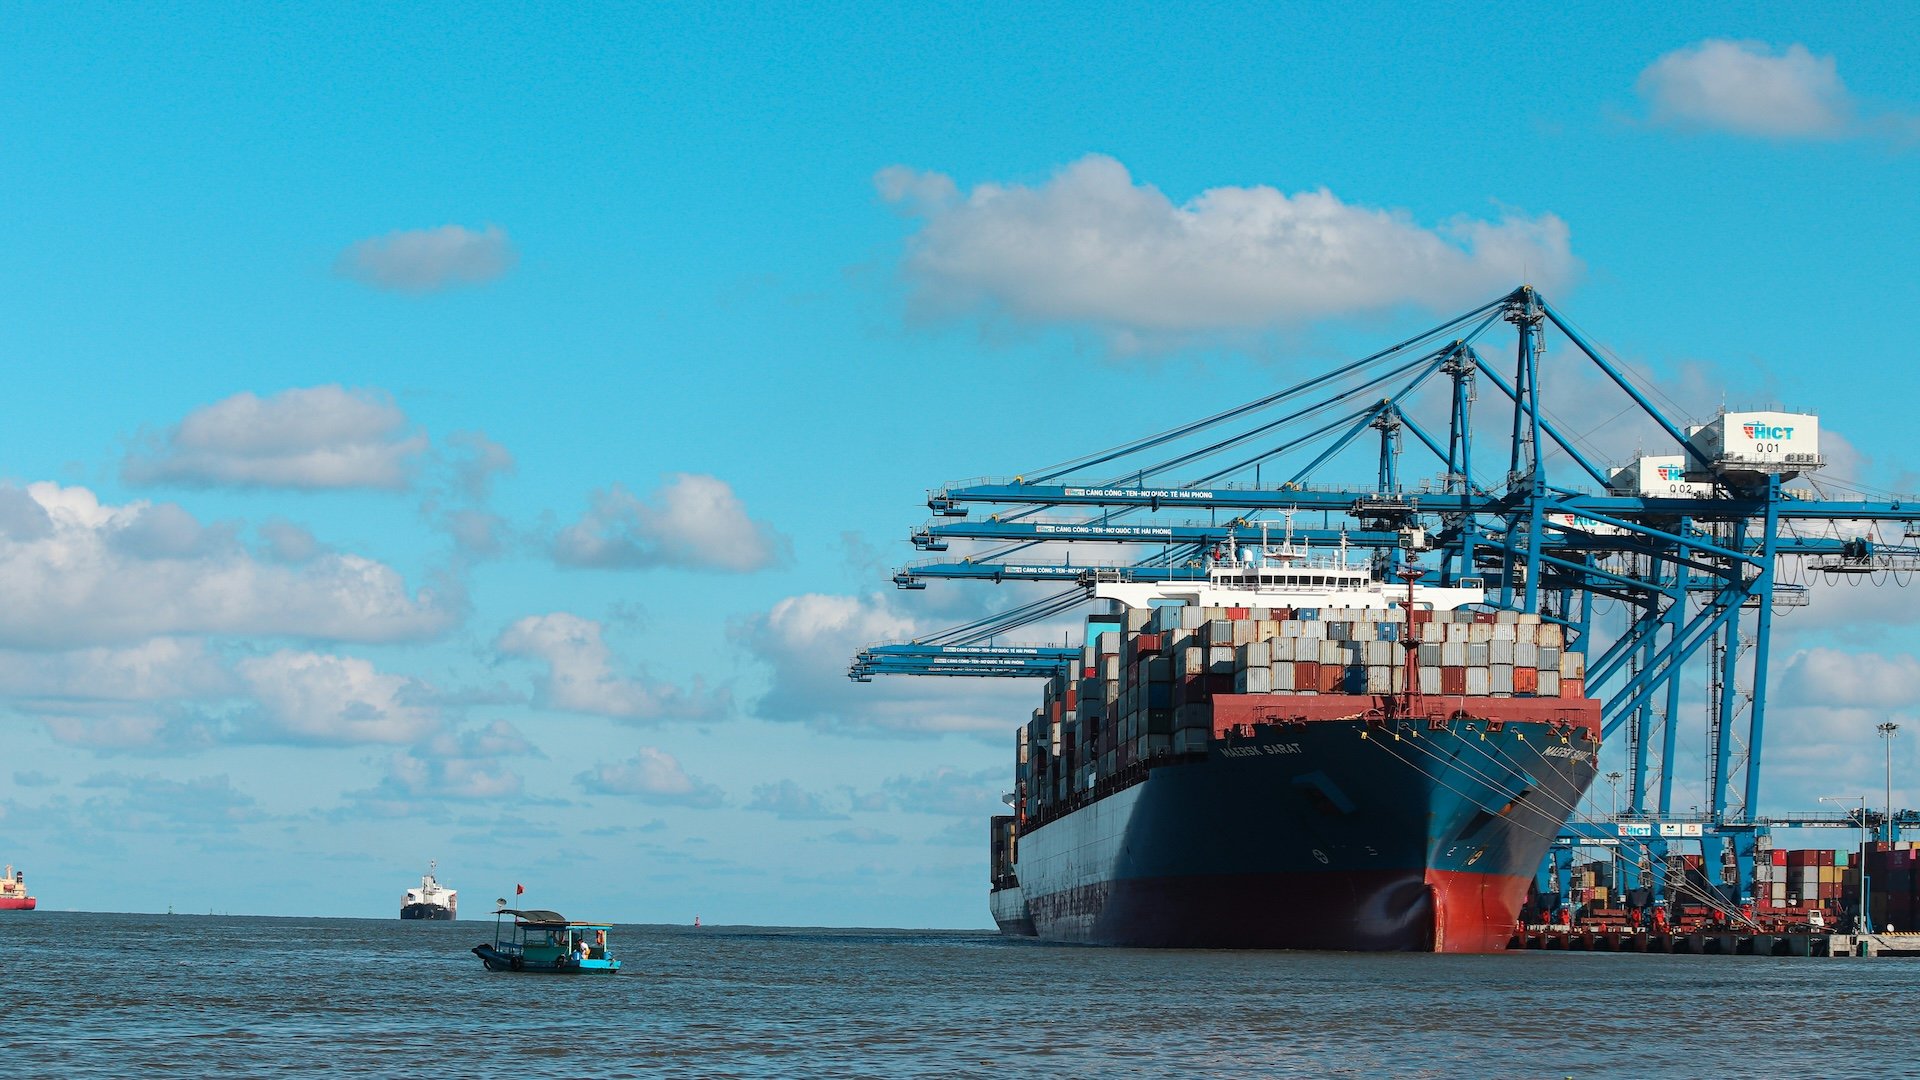
The 10 largest U.S. ports showed a 5.5% year over year decrease with inbound volume in November. Total outbound volume into the U.S. in November was down 5.6%.
Inbound In-depth
The 10 largest U.S. ports showed a 5.5% year over year decrease with inbound volume in November. This comes after October’s 8.0% decrease and September’s 6.6% decrease. Anomalies including the ripple impact from last year’s ILA situation along with sequential and longer-term comparisons suggesting further frontloading made the inbound volume decline less than it otherwise would have been. The three-month trailing figures are presently a better measure of the underlying trend and the 6.7% decrease in November was a noteworthy expansion from October’s 4.8% decrease. Going forward, inbound volume into the U.S. both in terms of three-month and monthly figures will show consistent and more pronounced year over year declines into next year in the absence of any changes to the current tariffs.
Inbound loads this November compared to November 2019 were 21.1% higher which is equivalent to a six-year CAGR of 3.2%. That growth rate measure was above the 1.7% in October, 2.1% in September and 3.0% in August. It was below the 3.4% in July but above the 1.6% and 0.8% growth measures for June and May. The underlying trend still points downward.
The medium-term comparisons to the same month in 2019 are important metrics that have the effect of jumping over and therefore netting out the roller coaster impact of the pandemic and getting at the underlying growth rate. The latest actual growth rate of 3.2% compared to 2019 is still below the 3.8% ten-year CAGR that total inbound loads grew in the decade from 2010 to 2020.
Outbound In-depth
Total outbound volume into the U.S. in November was down 5.6%. While that is a sharp contrast from October’s 16.2% increase, that was an anomaly resulting from last year’s short-lived ILA strike that had shippers diverting outbound shipments from East/Gulf Coast ports as the contract deadline approached without resolution. That came after a 0.5% increase in September and a 0.5% decrease in August. That back and forth followed a 2.0% increase in July and a 1.7% decrease in June. While outbound volume has shown that type of erratic pattern on a month-to-month basis for over a year, a more definable downtrend is emerging and is evident by the underlying downtrend in the 0.4% decrease in trailing twelve-month volume. I expect year over year decreases in outbound volume will be more consistent going forward as the impact of countervailing tariffs becomes more pronounced.
Tariff impacts
With all the moving pieces affecting volume in both directions, the trailing figures involving three or more months increase in relevancy in terms of highlighting the underlying trends. An overriding observation continues to be how rapidly adjustments have been made to worldwide supply chains with the catalyst being the actual and proposed tariffs by the U.S.
Actual and potential macro changes on both the production side and the marketing side underscore that the overall economics will be reassessed when large tariffs are introduced. In other words, supply chains related to goods moving in containers are very dynamic systems. As the actual data already shows, there have been adjustments and pivoting in terms of where container loads are going and this invariably involves China. Adjustments related to manufacturing and production sites generally take longer to occur but such shifts can be expected to be meaningful.
Global Perspective
In addition to the downward trends in inbound volume into the U.S. during 2025, another striking fact this year is the widening gap between trends in inbound volume growth in North America (driven by the five-sixths represented by the U.S.) and the rest of the world. Based on trailing three-month year over year changes during 2025 through October, the last month with comparable data, North America went from a 2.1 percentage point overperformer at the beginning of 2025 to a 14.0 percentage point underperformer now. Volume growth in many regions remains robust and world trade is moving on without us. Next year will be a year of consequence related to tariffs as the one two punch of the drag on economic growth from less inbound volume to the U.S. is compounded by the inflationary impact of the continuing loads and the consumption tax they represent.
When U.S. container volume data is compared to global data and data in other major areas, there is a noticeable and widening gap as the downtrends in U.S. lanes are being significantly mitigated by increased volume in other areas. Shifts are occurring faster than many might expect.
Worldwide container volume grew 2.1% year over year in October, some 10.1 percentage points or 1010 basis points better than the 8.0% inbound volume decline to the U.S. that same month. Another tangible indication of strength in other global markets is the growth of imports in other major regions. Container imports to Africa (up 9.9%), Mideast/India (up 7.3%), and South/Central America (up 6.5%) are all robust. On the other hand, imports to North America (down 6.7%) driven by the U.S. (down 8.0%) are languishing and declining. World container supply chains have already begun to adapt and reconfigure trading patterns.
The full year 2024 saw a 15.2% increase in total inbound loads to the U.S. compared to 2023. To say that the annual total for 2025 will be in diametric contrast is an understatement. More are now agreeing with the point that I have repeatedly made in earlier reports this year that the tariffs will result in an actual decline in 2025 inbound volume when the full year is compared to 2024. However, that will have no relation to the much more significant decline I expect 2026 will represent compared to 2025.
The CTS data is compiled based on shipment date and the loads show as an export at one place and an import at another place. There is no timing difference in the CTS data and that framework can have it out of synch with port data that is based on actual shipment and arrival dates. As such, the CTS data for a given month includes loads that will actually arrive one or even two months later. When the data is followed closely, that can have the CTS data telegraphing volume trends.
These container volume reports not only telegraph future economic activity driven by the law of large numbers, but they will be a particularly useful tool for the balance of 2025 and into 2026 as they provide data to assess the impact of tariffs on both economic activity and growth as well as inflation.
Worldwide data is just through October as that is the latest month available from CTS. The worldwide volume growth of 2.1% in October was well ahead of volume growth measures in the U.S. that had inbound volume down 8.0% and total volume down 1.7% with the year ago ILA anomaly related to outbound volume driving the latter. The gap with both measures is guaranteed to grow and widen in the months ahead.
Pricing
October’s CTS global pricing index is now out and it was down 3.9% from the September level. Compared to its overall 2024 average, that latest monthly index is 24.2% lower. The year-to-date average CTS global pricing index through October is down 15.4% compared to its overall 2024 average.
The October index brought the actual trailing three-month average to 76.7, or 4.5% below the actual 3Q25 average of 80.3 and 5.0% below the actual 2Q25 average of 80.7. From its recent monthly peak level of 118 in July 2024, except for a temporary spike in June, the global pricing index has been declining since then. That July 2024 peak itself resulted from an uptrend since the November 2023 level of 69 and is largely a result of the Red Sea situation.
Note that the CTS global pricing index uses actual 2008 rates as the base set to 100 and they are not inflation adjusted. That level of 69 was the lowest monthly reading over the last five years and approximates where the index was consistently prior to the pandemic. That overall non-inflation adjusted pricing today is less than it was decades ago is another indication that speaks volumes about the cost efficiency of container shipping. The CTS global pricing index level and trend is the most credible measure of sector pricing and the most relevant pricing index to use in any projection of industry results.
The latest readings on the SCFI index, the most closely followed spot index measure, augment overall pricing insight into the container sector. Pricing in most container lanes involving the U.S. shows trends similar to those in broader measures as the lanes are invariably linked in what is really a single pricing matrix. While there are credibility issues with the various spot pricing indices based on how they are determined and who provides input, they do provide information on the direction and trend of pricing.
The SCFI began trending down last December and, except for a summer bump due to frontloading, has generally been in a downtrend except for some recent upward movement the past few months. The latest SCFI reading of 1553 on December 19 is 4.9% above the 3Q25 level of 1481 and 5.6% below the average 2Q25 level of 1645. In the last twelve weeks, however, the index has increased 39.3% from a reading of 1115 on September 26 which was the lowest the SCFI has been since 12/15/23 when it was at 1094. Note that the late 2023 reading was towards the end of the quarter where the industry reported a small loss as the pandemic effect had ended and it was just before the Red Sea situation provided another notable capacity situation that would sharply push up industry results. What has been pushing up spot rates most recently is capacity reduction in the form of the largest number of cancelled sailings seen since the early days of the pandemic. This is driven by the reduced shipment volume that is occurring as a direct result of the tariffs and other initiatives such as the USTR ship fees. This is another indication of the downward trajectory in container volume that will become apparent in the months ahead.
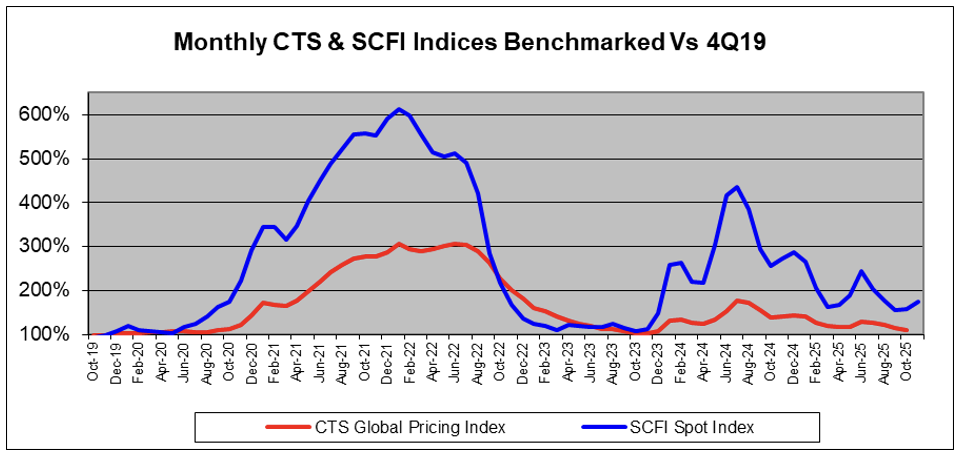
The following chart shows the average monthly level of both the CTS global pricing index and the SCFI over the last six years benchmarked against the actual 4Q19 average level. As is readily apparent from looking at this chart, most contracts, which typically have one-year terms, did not reset at the then current spot rate when they were renewed. That speaks for itself in terms of highlighting differences other than timing between the CTS global pricing index and the SCFI. There has recently been more of an immediate linkage between the two measures and that is a result of more contracts now that have provisions where contract pricing is not fixed and can be adjusted due to changes in specific indices within the contract year.
Key Data Observations For This Month
November’s overall inbound volume of 1,936,767 TEU’s was sequentially 1.7% below October. The sequential decrease last November was much higher at 4.3% and that is another factual indication of some anomalies in the November volume data making it higher than it otherwise would have been. These sequential comparisons have the benefit of recency, but the varying number of days in most months injects a 3-10% volume variance and there are also seasonal differences as you go from one month to another. Both of these facts make direct seasonally unadjusted comparisons not particularly relevant.
Shifting Port Traffic
The 64 months after the beginning of the pandemic effect on container volume began in August 2020 can be thought of as a new era in container shipping. That period first included volume gains from increased consumer spending, then decreases from the rebound of that and more recently underlying volume strength followed by the downtrends evidenced this year. We are now moving into another volatile period that will be overpowered by tariffs pushing volume down. July and August were temporary respites, as was November, and declines will return in a more pronounced way based upon the tariffs now in place. November’s overall inbound volume was 2.2% below that 64-month average. East/Gulf Coast ports were 2.2% below their 64-month average while West Coast ports were 2.3% below their average.
The West Coast ports have outperformed the East/Gulf Coast ports in nineteen of the last twenty-eight months. Those nine months that were the exceptions, including the four most recent months, were a return to the period before the last twenty-three months that saw a streak of 26 straight months where the East/Gulf Coast ports out-performed West Coast ports.
November showed a 10.3 percentage point coastal gap favoring East/Gulf Coast ports based on an 10.4% decrease at West Coast ports compared to the 0.1% decrease at East/Gulf Coast ports. That was above the 10.2 percentage point October advantage, the 5.3 percentage point September advantage and the 10.0 percentage point August advantage of East/Gulf Coast ports. The last four months were a flip from the 7.2 and 1.8 percentage point coastal gaps favoring West Coast ports in July and June.
The trailing three-month figures give a clearer picture of trends and the recent westward shift that has now abated. In November they showed the East/Gulf Coast ports with an advantage of 8.6 percentage points compared to 8.5 percentage points in October and 2.7 percentage points in September. That extends on a trend that is a sharp downturn with November diametrically different than the 25.8 percentage point record West Coast advantage for the three months ending November 2023. Only seven of the last twenty-eight periods had East/Gulf Coast ports outperforming on this metric. The West Coast advantages go back to September 2023 and East/Gulf Coast ports had the advantage during the prior 29 months.
Over the six-year period, the [eastward] trendline points to an average shift of 55 basis points per year. If the data were looked at over the eight-year period, the shift would be more in the range of 90 basis points per year. These periods benefited from the expanded Panama Canal and the more than three times larger container ships it allowed so the shift going forward will not be as high. However, my analysis is that there will continue to be an eastward shift in the range of 40 basis points per year. This will be driven primarily by the superior cost economics of moving containers by water compared to land as well as relative U.S. population distribution and growth.
Detail On Latest Month Data
Export boxes over-performed import boxes from mid-2022 to late 2023, but since then have shown erratic moves but that have been in a general downtrend with the longer-term metrics. Overall outbound volume was down 5.6% in November. There are some anomalies in that comparison due to the short ILA strike last October that continued to impact year ago November volume. As such, this November was a sharp contrast and below the 16.2% increase in October, also distorted by the ILA situation, and a 0.5% increase in September. Twenty-three of the last forty months have shown increases following fourteen straight months of decreases. The trailing twelve-month figure in November for total outbound volume showed a decrease of 0.4% compared to an increase of 0.8% in October and a decrease of 1.3% in September. Except for the October spike, that metric has been negative the last six months in contrast to positive readings in the preceding 27 months. That longer term metric continues basically in the downtrend as it has been through most of 2025.
With exports, only 24 of the last 69 months have shown year over year gains, with a 1.4% average monthly decline over the period. While total inbound loads this November were 21.1% above what they were six years ago during November 2019 for a 3.2% CAGR, total outbound loads were 5.9% less for a negative 1.0% CAGR. That 420-basis point difference in directional growth rates over a six-year period is a noteworthy divergence in the overall performance of exports compared to imports over the same period. The November metric was above the 370-point difference in October and the 330-basis point difference in September.
As we learned during the pandemic, when inbound volume ultimately destined for the U.S. is dispersed on a wider range of ports including Mexico and Canada, that often results in supply chain issues due to those changing patterns. That dispersion during the pandemic resulted from port capacity issues, but the dispersion now and in the near-term future will be driven by tariffs. With the amount of the tariffs, there are all sorts of strategies that will be looked at by shippers and carriers as potentially having a net favorable effect. Most of those strategies will involve less economic activity in the U.S. while increasing direct supply chain costs and resulting in uncertainly and unpredictability. The latter could often have a more adverse overall impact than the direct cost. Beyond that, there will also be much that will be studied and analyzed by manufacturers and producers with the relative changes tariffs are injecting into relative cost economics but those changes will be further down the road.

This is an excerpt of the McCown Container Volume Observer, which features an exhaustive deep dive into the facts and figures behind U.S. container shipping volumes, including analysis of monthly trends by port and by direction. The observations and data in the 25-page report include some 20 graphs and tables, providing timely container volume and pricing information. To subscribe to The McCown Report, visit The McCown Report site.
About the author: John D. McCown is an internationally recognized shipping expert with over four decades of experience in the sector. He currently serves as a Non-Resident Senior Fellow at the Center for Maritime Strategy, the think tank of the Navy League. McCown was the co-founder and former CEO of U.S. flag container carrier Trailer Bridge, Inc. He also focused on the shipping and transportation industries from an investment perspective as the transport sector head at a $20 billion hedge fund.


