

The logistic sector has looked a lot different in 2025 than in previous years, largely due to the waterfall of trade actions by the U.S. government. Tariff announcements, delays in implementation and the disparities between tariff rates between countries have forced textile and apparel firms to place bets on inventory quantities and timing. The result is uncharacteristic spikes and lulls in freight and warehousing demand. The volatility has been compounded by the end of the de minimis exemption in the U.S., which has cratered demand on air freight while companies that had been reliant on importing duty free low-value goods search for other options.
Here, HGI provides a look at where ocean freight, air freight, trucking and warehousing rates and demand stand now, and insights into what to expect from these sectors in the months ahead.
Ocean Freight
Figure 1. Ocean Freight Rate Snapshot for 40-Foot Equivalent (FFE) Ships
| Route | Baseline (July 2019) | Peak (Sept 2021) | July 2025 |
|---|---|---|---|
| Los Angeles to Shanghai | $978 | $1,710 | $790 |
| Shanghai to Los Angeles | $1,465 | $11,320 | $2,675 |
Tariff Impacts on Ocean Freight Rates
The United States trade war has impacted the flow of goods in 2025, as brands and retailers doing business in the U.S. have sought to insulate against higher duties. For some, that meant pausing operations while others opted to frontload shipments ahead of tariff deadlines.
With the pause on reciprocal tariffs set to end in early August, the Port of Los Angeles reported its busiest month in its 117-year history in July 2025, recording 1,019,837 20-foot equivalent units (TEUs) of imports and exports. The last time a port in the western hemisphere managed over one million TEUs in one month was during Covid in May 2021, when the Port of LA recorded 1,012,048 TEUs.
Since then, the pause on additional tariffs on China has been extended to November 9 and the U.S. imposed a 25 percent tariff on India on August 7; the tariff is set to increase to 50 percent on August 27. Brazil’s tariffs also increased to 50 percent effective August 7. It remains to be seen how these trade actions will affect Q4.
Gene Seroka, executive director of the Port of Los Angeles, is not anticipating another flood of goods, saying he feels inbound freight “may have just peaked.” Speaking on a webinar in August, Seroka said, “A lot of inventory is already here…. I don’t expect a flood of cargo, despite all the trade announcements coming out of Washington.”
In fact, the Port of LA projected ocean freight inventory would decline by approximately 10 percent in Q4 compared to last year, citing frontloading and elevated comps in 2024.
In line with that projection, Maesrk, a leading global shipping operator, forecasted in its May 2025 Investor day report its freight rates will decrease moderately for the second half of 2025.
Shanghai to Los Angeles Freight Rates
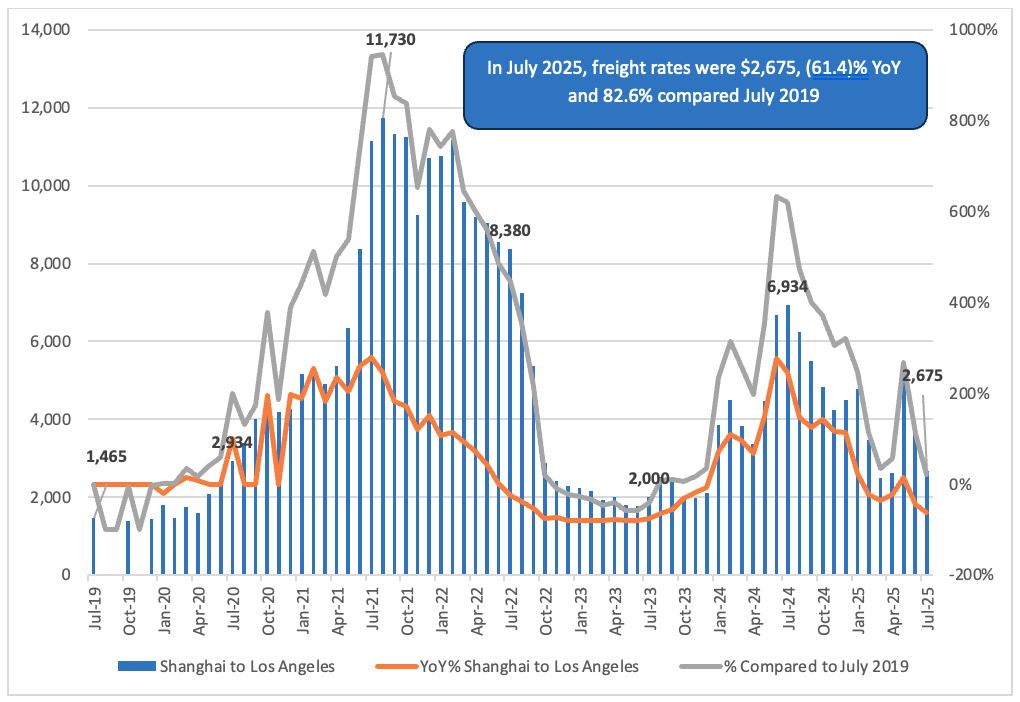
Analyzing the Shanghai to Los Angeles route, freight rates were $2,675 in July 2025, down from $3,741 in June 2025 and the 2025 peak of $5,172 in May. The July 2025 freight rates on this route were down 61.4 percent YoY, given the pricing pressures the sector faced in 2024. Chief among them were robust consumer demand post-pandemic, rerouting due to the conflict in the Red Sea, and port congestion at major hubs, including southern China, India and Southeast Asia.
Zooming out further, freight rates from Shanghai to Los Angeles soared to more than $11,000 per 40-foot equivalent unit (FFE) at its peak in September 2021 as a result of a consumer spending surge after pent up demand due to the pandemic.
Figure 2. Freight Rate of FFE from Shanghai to Los Angeles in US$, July 2019 to July 2025, YoY% and % Change Compared to July 2019
Los Angeles to Shanghai Freight Rates
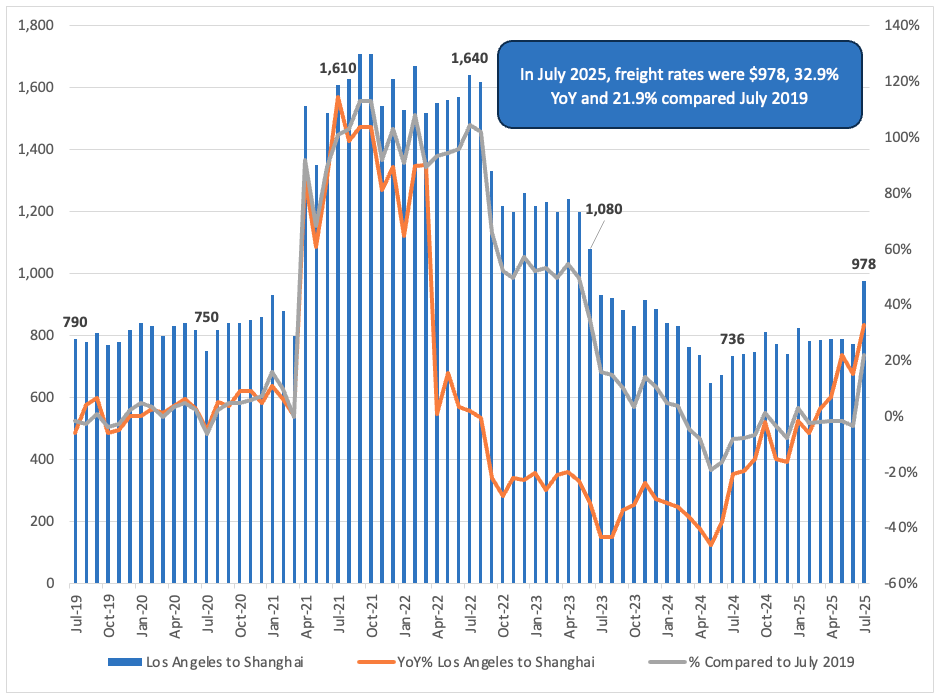
Outbound rates from Los Angeles to Shanghai have been more stable with less dramatic spikes. This is typical because more than half of the imports from China are demand driven, while exports are not.
The outbound rate from Los Angeles to Shanghai was $978 in July 2025, up 32.9 percent YoY.
These rates represent a 21.9 percent increase over July 2019. Outbound rates peaked in September 2021 at $1,710 per FFE — twice the July 2019 rate.
Figure 3. Freight Rate of FFE from Los Angeles to Shanghai in US$, July 2019 to July 2025, YoY% and % Change Compared to July 2019
Other Ocean Freight Rate Impacts to Watch
- New ship fees: The United States will begin charging fees on Chinese-owned, -operated, and -built vessels arriving in U.S. ports starting October 14, 2025. The fee will be set at $50 per net ton for Chinese vessel operators and owners, and the fee will recur up to five times a year per vessel. Additionally, the fee will increase by $30 per ton per year each year after. Fees on Chinese-built vessels face a similar but lower schedule rate. This could pressure freight rates, as Chinese companies will increase rates to account for the fee.
- Continued disruption: Freight companies continue to route around the Suez Canal and Red Sea region. The region has been plagued with problems. Initially a container ship blocked the canal in March 2021, and more recently Houthi rebel attacks on container ships in the Red Sea have all but ceased container transits, forcing vessels to reroute around the Cape of Good Hope. Disruption impacts are expected to last throughout the end of 2025.
- Restored service: After drought-related issues, the Panama Canal Authority announced the waterway is back to normal operations during its Q3 Market Call on July 9.
Air Freight
Figure 4. Drewry Airfreight Price Index ($/KG)
| Route | Dec 2023 (Peak) | July 2025 |
| Asia to US | $9.11 | $5.19 |
Tariff Impacts on Air Freight Rates
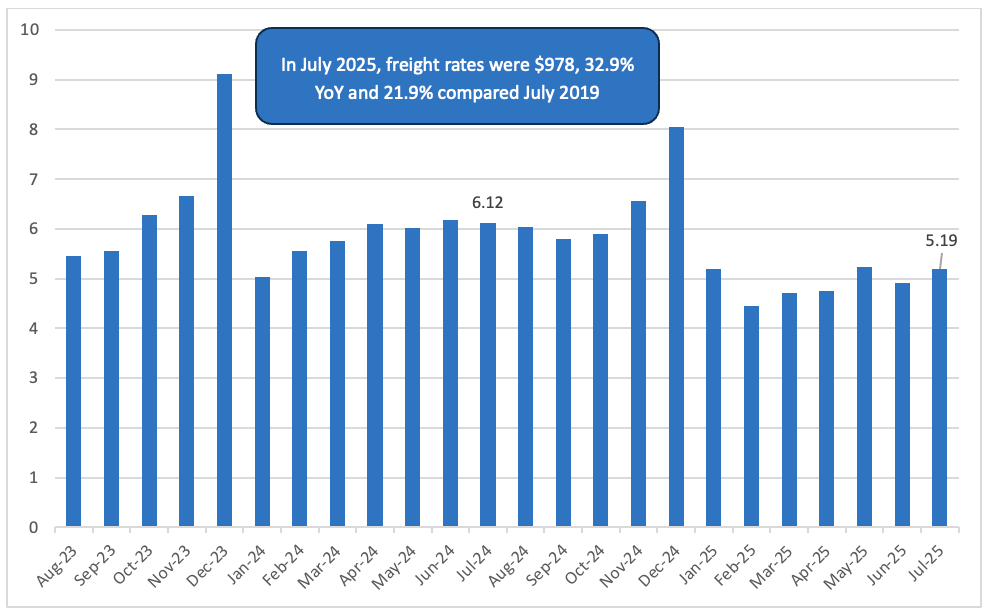
The air freight rate from Asia to the U.S. was $5.19/kg in July 2025, according to the Asia-U.S. Drewry Airfreight Price Index. Air freight rates have steadily ticked up from $4.45/kg in February 2025 due to tariff announcements and companies frontloading.
The July 2025 rate represents a 15.2 percent decrease from the July 2024 rate of $6.12/kg. Like ocean freight rates, air freight rates are ranging between 13 percent to 20 percent lower than the high comparables in 2024.
The International Air Transport Association (IATA) reported trade tensions prompted North American traffic to fall by 8.3 percent YoY in June 2025, while capacity decreased by 5.1 percent year-on-year. European growth stagnated at 0.8 percent during the period. Meanwhile, Asia-Pacific traffic expanded by 9.0 percent.
The IATA projected a slowdown in global air freight for the second half of 2025 to 0.7 percent YoY. The decline in ocean freight rates will also make air freight less competitive.
De Minimis Impacts on Air Freight Rates
The end of de minimis is also negatively impacting air freight volumes. After excluding goods from China from de minimis eligibility in May 2025, the Trump Administration will end the de minimis provision for all commercial shipments, effective August 29, 2025. This means goods valued under $800 no longer enjoy duty-free entry into the U.S. That compounded by rising tariffs is threatening shipper profitability.
Both FedEx and UPS count the China-U.S. route as their most profitable. For UPS, that route accounted for 11 percent of the company’s business, while for FedEx that number is about 2.5 percent.
In the company’s earnings call, FedEx said as volume out of China “deteriorated sharply” in early May, it cut capacity between China and the Americas by more than 35 percent.
On UPS’ Q2 2025 earnings call dated July 29, 2025, the company reported the tariff announcements and the elimination of de minimis exception resulted in a YoY decline in average daily volume of 34.8 percent for May and June.
Figure 5. Air Freight Price Index Rate, Asia to the US (Eastbound Route), August 2023 to July 2025
Trucking
Figure 6. U.S. Trucking Snapshot Cass Inferred Rate Index
| Sector | July 2019 (Baseline) | June 2022 (Peak) | July 2025 |
| Trucking | 2.44 | 3.89 | 3.12 |
Trucking (flatbed) spot rates and contract rates increased month over month in the first half of 2025, illustrating a demand to move products.
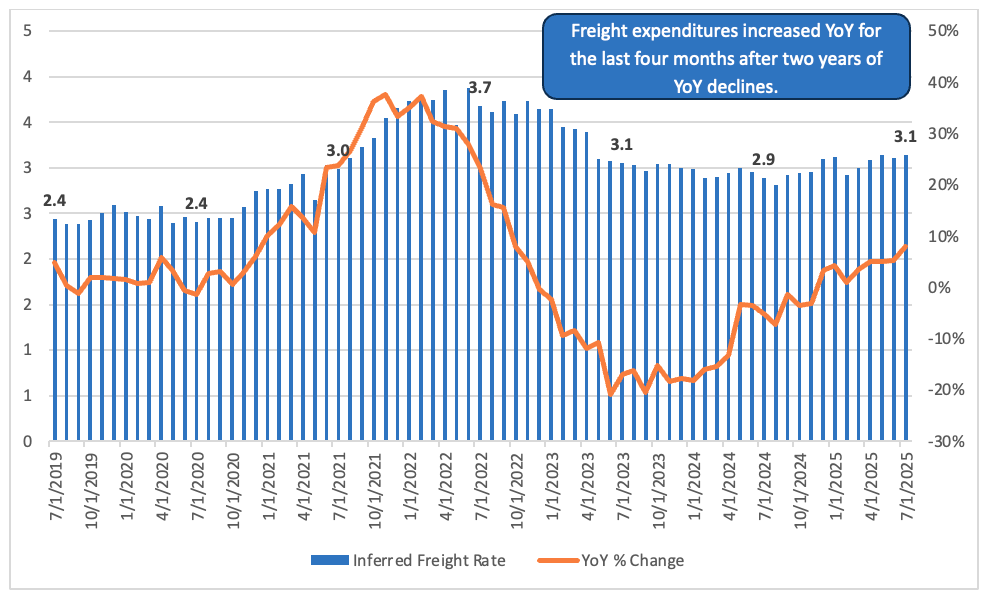
In July 2025, the Cass Index, which measures truckloads, less than truckloads, rail and parcel across North America, increased 7.9 percent YoY, to 3.1. Shipments alone dropped 6.9 percentYoY, to 1.033 during the same period. Expenditures, which is a measure of total dollars spent on freight transportation and includes contract and spot rates, were 3.225, up 0.4 percent over the previous year. This was the fourth consecutive month of positive year-over-year increases after two years of declines.
Truck rates are likely to tick down as brands and retailers in the U.S. work through the glut of frontloaded merchandise. According to the Port of LA, tariff uncertainty is projected to negatively affect overall cargo volumes in the latter half of the year, potentially leading to a decrease in demand for trucking services and impacting rates.
Figure 7. Inferred Freight Rate, 7/1/2019 to 7/1/2025 and YoY % Change (right axis)
Warehousing
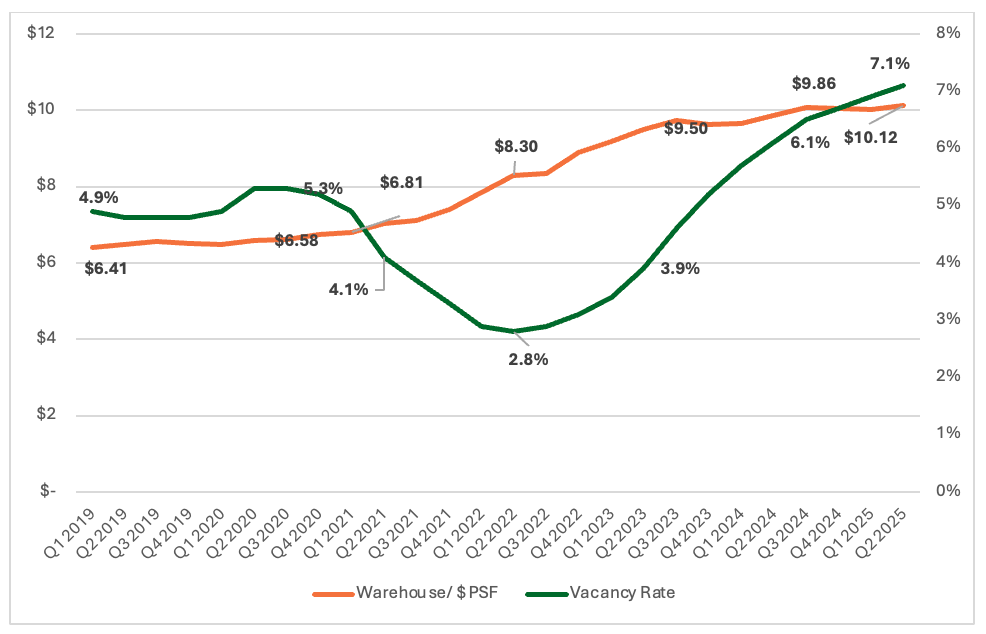
Figure 8. Warehouse Rates & Vacancies
| Measurement | July 2019 (Baseline) | Q2 2025 (Peak) | July 2025 |
|---|---|---|---|
| $/PSF | $6.41 | $10.12 | $10.12 |
| % of national industrial vacancy space | 4.8% | 7.1% | 7.1% |
Average industrial vacancy rates in the United States are the highest they’ve been since 2013, reaching 7.1 percent in Q2 2025, according to Cushman & Wakefield. One major driver is oversupply of new industrial space construction. The biggest surpluses are in the large spaces, those measuring more than 250,000 square feet. Vacancy rates for those are 10 percent vs 4.4 percent for warehouses under 100,000 square feet.
With 65 percent of new construction that came online in Q1 vacant, Cushman & Wakefield predicts vacancies will hit 7.8 percent next year.
The national industrial rate was $10.12 per square foot in July 2025, up 6.1 percent compared to Q2 2024. Warehouse rents have continued their upward trajectory, though more slowly than in 2022 and 2023. Rent rates are likely to continue to increase gradually, as vacancy rates stabilize.
Figure 9. Q1 2019 to Q2 2025 Industrial Rates $ Per Square Feet ($PSF), Vacancy Rate % (Right Axis)
Dr. Zachary Rogers, assistant professor of supply chain management at Colorado State University and a lead author of the Logistics Managers Index, said on a Port of Los Angeles webinar in August that much of the frontloaded merchandise is currently in the middle mile.
“Inventories are very expensive right now, and that’s for two reasons. One is the tariffs. And the other is that so much inventory is already here, and it’s really put stress on the warehousing network,” Rogers said. “We brought a lot of inventory forward in January, February, March. The movement looked like they do normally in August, September and October.”
The need to bring in goods early has led to a boom in bonded warehouse space. The U.S. has more than 1,700 bonded warehouses, which allow brands and retailers to hold imported goods duty-free until they’re needed. Reuters reports space is scarce and prices are four times that of non-bonded warehouses. Lack of capacity has some companies seeking to certify other spaces as bonded warehouses, but U.S. Customs & Border Protection is now facing a backlog of applications.
Companies are also turning to bonded warehouses to hold goods and delay paying duties until they are needed. Logistics company ShipBob reports renting more than twice the number of FTZ spaces on the West Coast this year than in the past. “The number one category that we’re seeing is apparel, followed by beauty,” ShipBob’s co-founder and COO Divey Gulati told The Wall Street Journal in August.
—Additional reporting by Caletha Crawford


